Incidence of Malaria in Khyber Pakhtunkhwa Pakistan - A Meta-Analysis- Juniper Publishers
Juniper
Publishers- Open Access Journal of Annals of Reviews & Research
Abstract
Background: Malaria is a fatal disease normally transmitted through the bite of an infected Anopheles mosquito. It is usually found in tropical and subtropical climates where the parasites responsible for causing the disease live. Five types of malaria parasites infect humans: Plasmodium (P) falciparum, P. vivax, P. ovale, P. malariae and P. knowlesi. P. vivax and P. falciparum are present in Khyber Pakhtunkhwa province of Pakistan, but no actual prevalence data is yet recorded. This study was commenced to precisely estimate the prevalence rate of Malaria across the province through a review of papers reporting prevalence data in the region.
Methods: The essential target of this efficient survey and meta-analysis was to describe the detailed clinical quality and the geographical variety of the prevalence of severe malaria, found in literature search from the databases, since 2003 to 2017. Abstracts and results of twenty-one papers were considered and the information was extracted, based on prevalence rate of malaria in general and local population.
Results: Out of the 21 studies chosen, on the basis of inclusive criteria, 18 studies were finally selected for further analysis. The combined estimate from the random effect model gave 13.81% prevalence. The prevalence of malaria sharply increased from 2013 onwards compared to the previous years. Highly significant (p-value < 0.0001) heterogeneity is observed among the studies. Further it is found that study no. 16, and 9 out of those included possess maximum contribution to the heterogeneity and are highly influential. The corresponding funnel plot reveals significant considerable asymmetry and publication bias.
Conclusion: Despite of malaria control program in recent years, the incidence of malaria is still in alarming situation at KP-Pakistan. Further analysis based on general population screening will be required to figure out the actual situation of malaria at KP-Pakistan.
Keywords: Meta-analysis; Incidence of malaria; KP-Pakistan
Introduction
Malaria is one of the major health problems and predominant of all parasitic infections in the world and is a major cause of sickness and mortality in developing countries including Pakistan [1]. Malaria is one of the five blood infection that infect the population easily and the most dangerous attack of malaria infection is caused when malaria parasites especially P. falciparum able to cause cerebral malaria [2]. Malaria is caused by protozoan parasite of genus plasmodium, which has different types P. vivax, P. falciparum, P. ovale, P. malariae and P. knowlesi of which the P. vivax and P. falciparum are most common all over the world [3].
In Pakistan malaria is the second most reported disease from the public health sector. Out of 123 districts of Pakistan, 91 districts (86.7%) are affected by malaria in the recent years. In Pakistan, 95 million people are once being infected by malaria [4]. In 2010, rise in malaria was noticed because the flood affected 20 million people in over 60 districts [5]followed by 41-50 years 185 (20.04%. Malaria is most common in rural areas because of the presence of more vectors and transmission rate in the rural area. The increase in Malaria in Pakistan is due to several factors including increased poverty, environmental decline and mostly the spread of Chloroquine resistance. According to the WHO 97% (approximately 150 million) of the Pakistani population is at risk of malaria, the transmission season is from September to November but high risk of malaria in KP is in the month of July and August [6].
Materials and Methods
Literature searching strategy
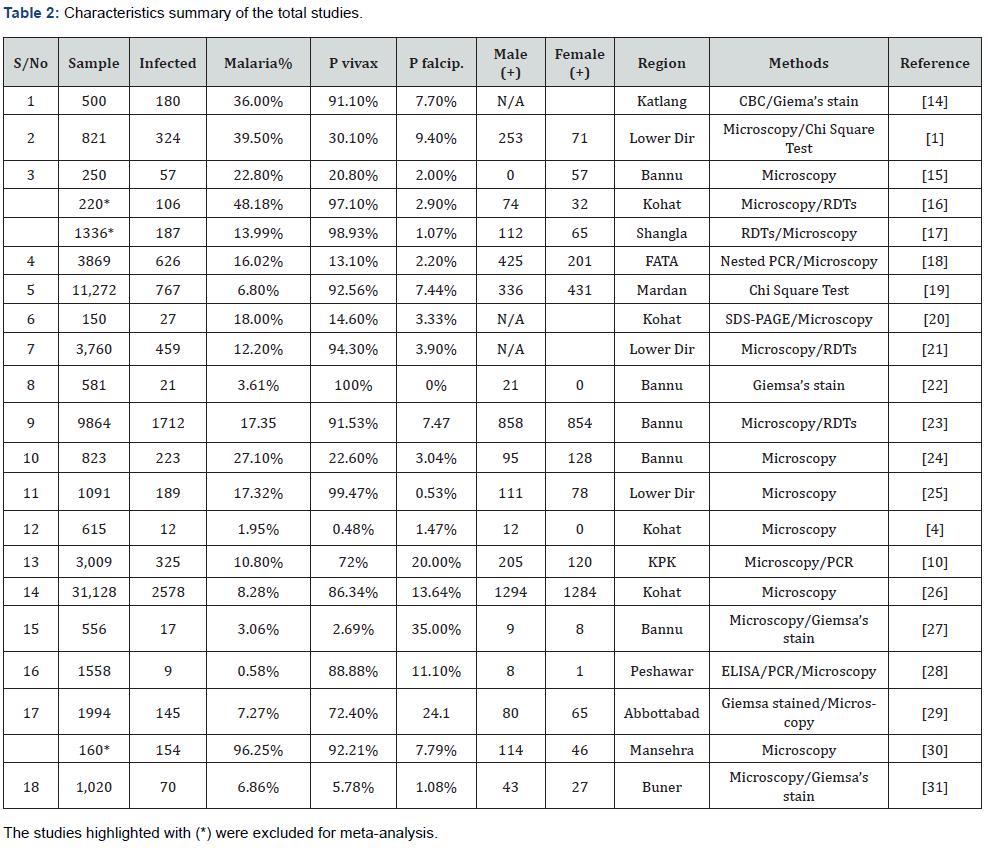
To incorporate meta-analysis, we searched Google scholar, Pub Med, SCI-Hub and NCBI for studies published from Jan 1, 2000 up to and including Oct 1, 2017, which assessed the prevalence of Malaria amongst all types of population, in different districts of KP-Pakistan. The search strategies we used were (Prevalence of Malaria in KP, Prevalence of Malaria in Khyber Pakhtunkhwa, Prevalence of Malaria in rural areas of KP, Prevalence of Malaria in Pakistan, Prevalence of Malaria in NWFP, Prevalence of Malaria in Karak, Prevalence of Malaria in Swat and Prevalence of Malaria in Peshawar). The name NWFP is used while searching because this was the previously used official name of the Province of KP. A total of 21 studies (abstracts and results) were carefully reviewed. Studies were included if details on the sample size, population and confirmatory tests were reported. A total of 18 studies were finally process for the statistical analysis. For all the 18 studies, study type, samples size, number of infections, the region where the studies were carried out and the percentage of two most common malarial parasites (P. vivax and P. falciparum) are subjected for statistical analysis Table 1.

Data synthesis and meta-analysis
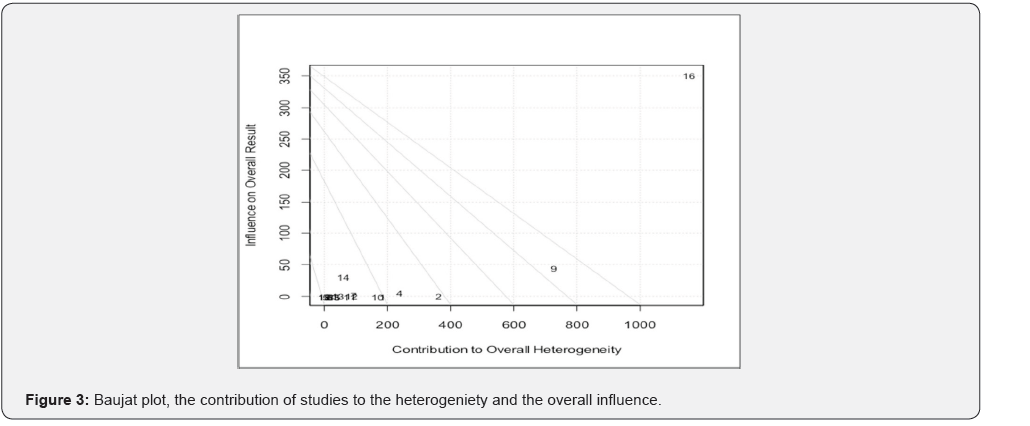
To investigate the prevalence of Malaria in the province of KP, we made use of the studies from 2003 to 2017, available in literature on the topic. For this purpose 21 studies were chosen, however, on the basis of inclusive criteria (based on sample size and sampling methodology adopted) 18 studies were finally selected for further processing. In order to integrate these studies and come up with a combined effect, the meta analysis tools were incorporated. As with any statistical tool, meta-analysis also has its strengths and limitations but is now one of the standard tools for providing transparent, objective, and replicable summaries of research findings in the social sciences, medicine, education, and other fields [7]behavioral scientists have increasingly come to rely on methods of meta-analysis to provide quantitative summaries of the research literature. There is probably no area of organizational research where meta-analysis has not had a major impact. Consequently, a solid understanding of the statistical methods used in meta-analysis is important not only for those who apply the technique but also for researchers and practitioners who need to critically evaluate the many meta-analyses appearing in the research lit-erature. Methods of Meta-Analysis: Correcting Error and Bias in Research Findings, by Hunter and Schmidt, is an excellent resource for learning about the rationale, computational procedures, and practical challenges faced when conducting a meta-analysis. This book is an update of the classic text by Hunter and Schmidt (1990. The heterogeniety among the studies was jugded from the test statistics like Q, I2 and tau square (τ2). The combine estimate of the studies involved was obtained for both fixed and random effect models. A better picture of the overall heterogenisty and combine effect is viewed using forest plot (Lewis and Clarke 2001) [8]. To know the influencial study, diagnostic tests were carried out with the help of Studentized Residuals, Difference in Fits (DFFITS) , Cooks Distance, Covariance Ratio, Tau Square, and the contribition of each study in the Q, H2 test statistics value and the weights assigned to these studies. To detect the sources of heterogeneity Baujat plot is used. For assessing the publication bias of the meta analysis, we made use of the Funnel plot and asymmetry of the plot was judged by regression test.
Results
Tests for heterogeneity
As indicated by Q statistics significant (p-value < 0.0001) heterogeneity is found among the 18 studies included in the Metaanalysis. Further, considerable higher degree of hetergeniety was observed among the studies, as indicated by the corresponding very high value of I2 and very low value of tau square test statistics.
tau2 (estimated amount of total heterogeneity): 0.0036 (SE = 0.0024)
tau (square root of estimated tau2 value): 0.0599
I2 (total heterogeneity / total variability): 99.48%
H2 (total variability / sampling variability): 192.73
Test for Heterogeneity:
Q(df = 17) = 3276.4746, p-val < .0001
On the basis of these statistics it was senseable to opt for the random effect model instead of fixed effect model. It was evident that the combined estimate from the random effect model gave 13.81% prevalence and the fixed effect model gave 7.09%. Both the model gave highly significant prevalence, however, the standard error and the corresponding confidence interval for the fixed effect model carried more precision.
Forest plot of the prevalence of maleria using fixed and random effect model
Forest plot (Figure 1) indicate the prevalence along with 95% confidence interval of the prevalence. The combined (pooled) estimate of the prevalence of malaria in KP using 18 studies is 13.81% from random effect model, while the corresponding estimate from fixed effect model is 7%. It is observed that the latest survey shows considerable higher prevalence as compared to earlier studies. It seems the prevalence of Malaria increased sharply from 2013 onwards. Further, the heterogeneity among these studies can be judged from the range of the prevalence, 1% to 39%. Except study no. 3 and study no. 6, the standard error of the individual studies are generally low. In the fixed effect model maximum weight (35.5%) is assigned to the patients study in 2013, which utlizes maximum sample size, blood donors study in 2010 also got considerably higher weight (23.5%). In case of random effect model, irrespective of the study size and the prevalence rate, weights assigned to the studies are only fractionally different. The heterogeneity measure obtained from I2 statistics and Chi-square test is highly significant.

Diagnostic test of the meta analysis of 18 malaria studies
To know the impact of each study in the analysis of meta analysis. In the first plot Stuentized Residuals are plotted for each study included in the analysis, which reveals that study no.9 (General Rural/Urban, 2013) and study 16 (Blood Donor, 2010) yield largest residuals. The plot of DIFFT (The difference in the fit when the particular study is omitted) shows that study 9 and 14 are making greater but positive difference to the model fit while study 16 possess largest retarding effect on the goodness of the fit. The Cooks distance is maximum for study 16 and slightly larger for study 9 and 14. The contribution of study 14 and 16 respectively possess largest contribution in the covaiance ratio test. The diagnosis further assess the contribution of each study in the test statistics used such that Q, I2, tau2, H. These measures are plotted on Y-axis against their study number on the x-axis. Tau square shows flatter line because the overall test statistics value in ours case is very low. Drastic reduction in the Q statistics is possible if study 16 and study 9 are omitted from the analysis.The line representing the contribution to the Hat (H) statistics and the weights assigned to the studies are identical, except study 14, 16 have the largest contribution which is followed by study 5 (Figure 2).

Baujat plot
Baujat et al. 2002 [9] proposed a diagnostic plot to detect sources of heterogeneity in Meta-analytic data. The plot (shows the contribution of each study to the overall Q-test statistic for heterogeneity on the horizontal axis versus the influence of each study (defined as the standardized squared difference between the overall estimate based on a fixed-effects model with and without the study in subject is included in the model) on the vertical axis. Figure 3 is showing the contribution of each study in the overall heterogeniety and the influence on overall results. Ranked in order of magnitude, Study no. 16, plotted on the top right corner, has outstanding contribution to the heterogeniety and highly influential as well, Study no.9 contributing high to heterogeneity and relatively more influential as compared to the others. Study no. 14 is contributing low in heterogeniety but relatively better in influence.

Funnel plot
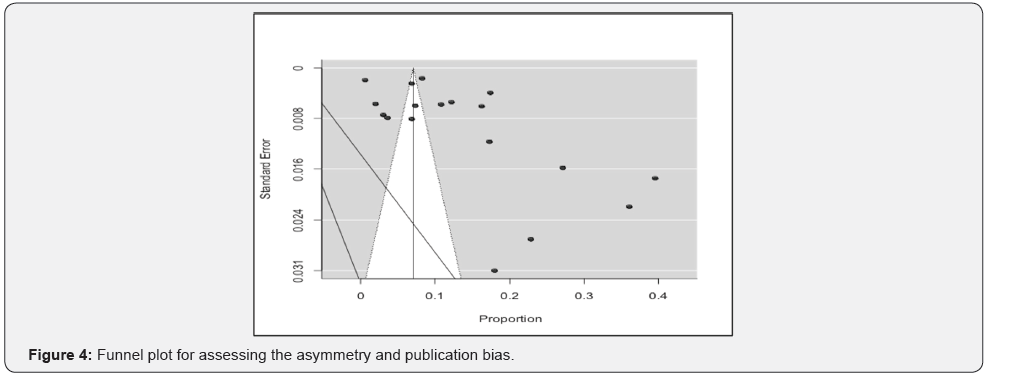
Funnel plot (Figure 4) shows that most of the dots are located to the right of the funnel, which consequently creats considerable asymmetry and publication bias. Considering fixed effect model and carrying out regression test indicates highly significant asymmtry, as evident from the resultant z =27.12, with p-value < .0001

Discussion
Malaria is a life-threatening disease. According to an estimate 6.8 million people are died with malaria globally since 2001. Our studies showed that the prevalence rate of malaria in KP is 13.81% according to the Random effect model and 7.09% according to Fixed Effect Model. It is noticed that KP as a disastrous hit province is the most malaria effected province of Pakistan as compared to the other three provinces i.e., Punjab (2.4%), Sindh (10.8%) and Baluchistan (3.8%) [10] we can conclude that malaria is the most prevalent in KP. Worldwide, in the period between 2010 and 2015, malaria incidence among populations at risk fell by 21% globally and during the same period, malaria mortality rates among populations at risk decreased by 29%. In a world where the prevalence of malaria is constantly reducing, Pakistan has to find a way to combat this disease. In order to fight malaria, the government of Pakistan has to develop strategies like the way the government of Sri Lanka did [11]. Sri Lanka is certified malaria-free, making it the second country to reach this status in the World Health Organization’s (WHO) region of South-east Asia. The first to be declared malaria free was Maldives in 2015 that has a population of nearly 400,000, compared to the population of Sri Lanka i.e. 20 million. Sri Lanka’s status of fighting the deadly malaria was against the odds as the country had high weightage of the disease.
Our studies have showed that prevalence of malaria has increased massively after 2013. This may be due to the disastrous factors like flood and terrorism. Beginning 31 July 2013, KP experienced unusually heavy rainfall that caused widespread flash flooding (4). Both P. falciparum and P. vivax are extensively distributed across KP due to wide agricultural practices, massive irrigation networks and monsoon rains. The transmission season of these parasites is post-monsoon, occurring from July to November. The increase in malarial prevalence after flooding is a renowned phenomenon. The onset of floods at the start reduces mosquito breeding. However, as the floods stop, the malariacausing mosquitoes extensively breed on stagnant pools of water left behind [12]. Army action against terrorism in KP has caused the largest human migration of this century. About 3.4 million IDPs (Internally displaced persons) were displaced. Due to the large number of displaced people an excessive burden was created on health services. The medical issues and requirements for these IDPs living in camps were totally different from natural disasters. The IDPs are more vulnerable to diseases. The major physical health problem associated with IDPs is malaria (85% in children and 48% in adults) [13]. In the Figure 2 of our study, we also see that the male individuals were more commonly affected than female. This is because males are more exposed to the open surroundings. No use of anti-malarial sprays, poor hygienic state, sharing of the house with livestock (animals), improper diagnosis, poor drainage systems, lack of awareness and load shedding also play a major role in the spread of malaria in KPPakistan.
Conclusion
It is concluded from this study that malaria still remains prevalent in KP with a prevalence rate of 13.81% (random effect model). Malaria is mostly caused in KP by two types of Bacterial viruses (Plasmodium vivax and Plasmodium falciparum), and P. vivax infection is higher as compare to the P. falciparum infection. It is suggested that malarial symptomatic patients should be properly treated with anti-malarial drugs to lower the complication and mortality rate and to save the lives of people. The government has to plan a proper strategy too to combat the malarial viruses. One of the important factors highlighted by the analysis is the large amount of disparity among the studies included in this study. This situation guides line that though more sophisticated statistical tools like Meta-analysis provide tools for integrating studies on the same topic, however, more care, focus, and attention is needed in carrying out sampling survey relevant to any field. In particular, the appropriate use of survey and sampling tools needed to be throughly investigated (Table 2).

To know more about Juniper Publishers please click on: https://juniperpublishers.com/aboutus.php
For more articles in Open
Access Journal of Reviews & Research please click on:
https://juniperpublishers.com/arr/index.php


Comments
Post a Comment