Performance Evaluation of Feature Extraction and Modeling Methods for Speaker Recognition- Juniper Publishers
Juniper Publishers- Open Access Journal of Annals of Reviews & Research
Performance Evaluation of Feature Extraction and Modeling Methods for Speaker Recognition- Juniper Publishers
Authored by Mustafa Yankayiş
In this study, the performance of the prominent feature extraction and modeling methods in speaker recognition systems are evaluated on the specifically created database. The main feature of the database is that subjects are siblings or relatives. After giving the basic information about speaker recognition systems, outstanding properties of the methods are briefly mentioned. While Linear Predictive Cepstral Coefficients (LPCC) and Mel-Frequency Cepstral Coefficients (MFCC) methods are preferred for feature extraction, Gaussian Mixture Model (GMM) and I-Vector methods are employed for modeling. The best results are tried to be obtained by changing the parameters of these methods. A number of features for LPCC and MFCC and number of mixture components for GMM are the parameters experimented by changing. The aim of this study is to find out which parameters of the most commonly used methods contribute the success and at the same time, to determine the best combination of feature extraction and modeling methods for the speakers having similar sounds. This study is also a good resource and guidance for the researchers in the area of speaker recognition.
Keywords: Speaker recognition; LPCC; MFCC; GMM-UBM; I-Vector
Introduction
The rapid development of information technologies has increased the importance of information security and led to the emergence of the new types of crimes (cyber-crime) accordingly. It also benefits from information technology for the detection of cyber-crimes. Reliable and valid digital evidence must be obtained for the elucidation of cybercrime. It is important for the reliability of the methods to obtain and examine digital evidence correctly since they can be easily damaged.
Recently, criminal cases have increased depending on the nature of the crime, the methods developed for the solution also have changed. The use of biometrics in forensics becomes a common solution increasingly. Speech and speaker recognition methods have been added to the popular biometric techniques such as fingerprint, face recognition, etc. The speech signal has significant energy up to around 4kHz. It has discriminative features to identify speakers. Dissemination of audio and video recording systems, increasing usage of mobile phones, the presence of speech in most criminal cases further enhance the importance of speech as evidence. The importance of forensic speech and speaker recognition system will increase by the assumption of increasing number of crimes in the future. Session variability, the voice similarities between people (especially siblings and relatives), voice imitation, the health of the speakers, psychological situations of the speakers, and environmental noise are some of the most important problems to overcome for the current speaker recognition systems [1]. An automated speaker recognition system mainly consists of the acquisition of the data, feature extraction, and similarity matching. A template matching is conducted between the voice acquired from a microphone or from a file and the previously recorded voice database. This system operates in two modes including training and testing. A reference model is created for each user in the training mode. A new input signal is compared with the generated reference models in the test mode [2].
Human voice carries information about the different characteristics of the speaker (health, age, gender, psychology, language, and identity etc.) and the environment in which speech is recorded. Thus, the voice signal is used as a reliable and distinctive feature in many sectors (forensics, telephone banking, telephone shopping, security control, voice control of computers, etc.). Voice processing technologies can be classified into two main categories such as speech recognition and speaker recognition. While speech recognition is related to what the talk is, speaker recognition is about who the speaker is. Speaker recognition systems can be categorized as speaker verification, speaker identification, and speaker diarization.
Speaker verification
The speaker claims to have a certain identity. It can be likened presenting your passport at border control. Voiceprint of a speaker is compared with the speaker claimed to be the person in the database. After the comparison, if the likelihood ratio is above a certain threshold, a result of acceptance is returned. If the likelihood ratio is below a certain threshold, a result of rejection is returned. It is a vital issue to determine the threshold value. If a lower threshold value is taken, the system will respond to much false acceptance (false positive - I. type of error). It is not an acceptable situation for a system in which security is a concern. If a higher threshold value is taken, then the system will respond to many false rejections (false negative- II. type of error). In speaker verification, the performance is independent of the number of persons in the database since a one-to-one comparison is made.
Speaker identification
The speaker does not have any identity claims. In terms of operation, it can be likened comparing a sketch of the culprit with pictures in the database of criminals and finding the best match by a security guard. Voiceprint of a speaker is compared with the speakers in the database one by one. If all speakers are known by the system, it is called as “closed set” identification and the result is the best match. If all speakers are not known by the system, it is called as “open set” identification and sometimes there is a possibility of failure to a good match. In speaker identification, the performance is dependent on the number of persons in the database since a one-to-many comparison is made.
Speaker diarization
It is a kind of segmentation process that determining which speaker speaks in which part of the conversation in a speech signal belonging to two or more speakers. There are two stages in speaker diarization. Firstly, separating the speech signal into the segments in which a different speaker speaks. Secondly, finding which segment belongs to which speaker.
Speaker recognition can be realized in two different ways: text-dependent and text-independent. The text is previously known by the system in a text -dependent system. The speaker should speak a particular text (a word, a phrase, a password, digits, etc.) as an input to the system. Therefore, the texts in both the training and testing phases are the same. The risk is reduced and the system performance is affected positively. The text-dependent systems are mostly preferred in speaker verification. The text can be anything that a speaker speaks in a text-independent system which has a more flexible structure. The texts in the training and testing phases are different. Actually, the testing phase is realized without the knowledge of a person as in many forensic applications. The text-independent systems are mostly preferred in speaker identification.
Speech production process
Speech can be defined as sequences of sound segments called phones. Phones have certain acoustic and articulatory properties. Phones refer to the instances of phonemes which are smallest structural units that comprise words. The main components of the human speech production system are the lungs, trachea, larynx, vocal and nasal tract. Speech production is similar to the acoustic filtering. Lungs are like the power supply of the system which provides air flows through the vocal cords into the vocal tract. The vocal tract is the section that begins at the vocal cords and ends at the lips. The nasal tract begins at the velum and ends at the nostrils. The important organs having contributions to speech production are vocal folds (or vocal cords), tongue, lips, teeth, velum, and jaw [3]. Speech sounds fall into two classes according to vocal cords behaviors: voiced speech (the vocal cords vibrate at the fundamental frequency and air flows through them into the vocal tract) and unvoiced speech (the vocal cords are held open and air flows continuously through them). /a/, /e/, and /i/ are examples of voiced sounds and /f/, /s/, and /t/ are examples of unvoiced sounds.
Automatic speaker recognition process
The aim of automatic speaker recognition is to extract features and to differentiate the speakers. Automatic Speaker Recognition is performed in three main steps: feature extraction, modeling, and testing. The system operates in two modes: training mode and testing mode. A reference feature model is developed in the training mode. The input signal is compared with the reference model(s) in the testing mode to verify or identify the speaker. The general structure of the process is shown in Figure 1.
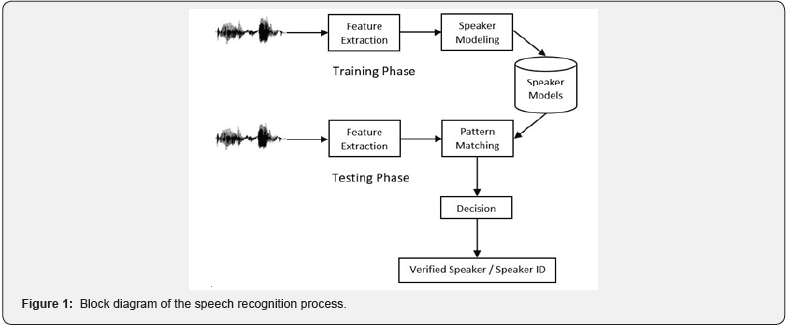
The outline of the paper is as follows. Section 2 elaborates feature extraction and speaker modeling principles. Section 3 provides application details. Section 4 is devoted to the results for method pairs. Finally, we discuss the evaluation of speaker recognition performance with different parameter values of the methods in Section 5.
Methods
The aim of this study is to reveal the effects on the results by changing the parameters of the feature extraction and modeling techniques. Therefore, studies were performed on several techniques such as Mel Frequency Cepstral Coefficients (MFCC), Linear Predictive Cepstral Coefficients (LPCC), Gaussian Mixture Model (GMM), and I-vector. The methods will be described briefly before the implementation details.
Feature extraction
Obtaining the values that characterize the speaker itself from a speech record is called feature extraction. It is a process for creating a small collection of data obtained from an audio signal. Feature extraction is vitally important for the performance of speech and speaker recognition systems. A feature should be easily accessible, and highly discriminative. It also needs to be protected. It should be trusted against imitation. A consistent feature is that the least affected by environmental factors (noise, microphone, telephone, etc.) and health conditions of the speaker (cold, flu, etc.) (Figure 1) [4].
Formant frequency is one of the short-term spectral features in speech and speaker recognition. A spectrogram of a speech signal displays audio components in three dimensions: time, frequency, and amplitude. The spectrum of vocal tract response consists of a number of resonant frequencies called “formants”. Formants are the spectral peaks of each 1 kHz part of the sound spectrum. Three to four formants are present below 4 kHz of speech. Though formant frequencies of voiced speech are more explicit at lower frequencies, those of unvoiced speech is more explicit at higher frequencies. Formants differ from each other according to voiced speech and speakers, so they are very important to distinguish voiced speech. In Figure 2 the spectrum, spectrogram and formant frequencies of a speech signal are given.
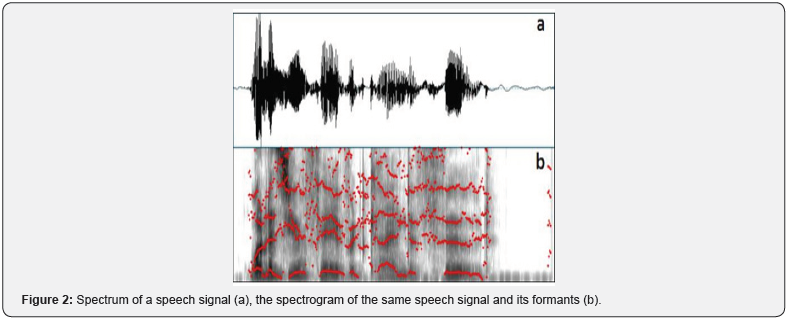
Another important feature in speech processing is pitch frequency. The vibration frequency of vocal cords because of the air from the lungs during speech production is called pitch frequency (or the fundamental frequency of a particular person). It is very important for tonal languages because when a word is said in different tones (pitch frequency) it comes to different meaning. Many feature extraction methods are used in order to elucidate the distinctive features that characterize a speaker such as formant and pitch frequencies. Two of the prominent methods are summarized below.
Linear predictive cepstral coefficients (LPCC): Speech is a combination of signals representing voiced sounds, unvoiced sounds, and transitions between them. Voiced sounds are periodic with a speaker dependent fundamental frequency in a short time interval (Pitch Period). They are directly related to the vibration frequency of vocal cords because of the periodic structure. Although unvoiced sounds are similar to the noise, they are low amplitude sounds which are non-periodic in nature (vocal cords do not vibrate) and corresponds a specific meaning. In addition to voiced and unvoiced sounds, there are some intervals with voice inactivity during a conversation (Figure 2).
The peak resonance points of a spectrum envelope are the results of articulators revealed from different acoustic pits through vocal tract. The resonance frequency locations vary because of changes in vocal tract shape and dimensions. The resonance frequencies that define the form of the whole spectrum are called formants. The model showing the production of the speech signal by applying a vocal tract filter to voiced and unvoiced sounds is depicted in Figure 3. Linear Predictive Coding (LPC) is a method for analyzing human voice and extracting features from the analysis. LPC analysis models the vocal tract as a filter (H(z)). Some fundamental speech parameters like formants and pitch frequencies can be obtained from the coefficients that are the results of the LPC method [5].
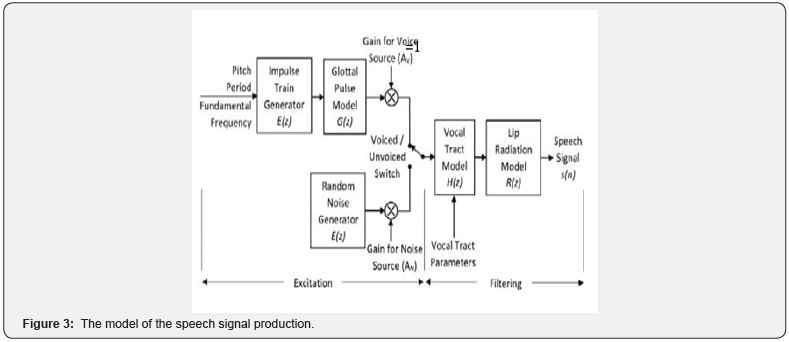
The basic idea of this method is the obtainment of the sample in “nth” time of a speech signal as a linear combination of previous samples. The sound samples (s(n)) in “nth” time can be predicted by previous “p” samples with a certain margin of error(e[n]).

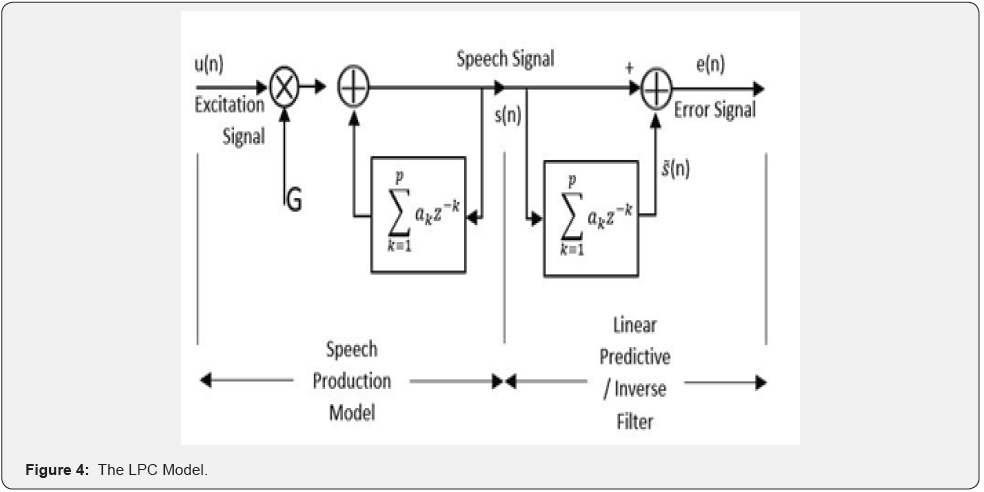
The error signal (e[n]) must be minimized. It must contain very little data in comparison with (s(n)). The system depicted in Figure 4 adjusts the coefficients so as to minimize the energy of (e[n]) (Figure 3,4).

s[n] is the speech signal, ak is the LPC coefficients, s[n] is the predicted signal.
Filter coefficients are assumed to be constant in certain ranges of the signal and LPC analysis is done in these frames that the signal is considered to be stationary. When LPC is applied to a frame of N samples length of a speech signal (N>>P), it gives linear predictive coefficients (a1, a2, a3, ap). These coefficients represent a significant portion of the signal.
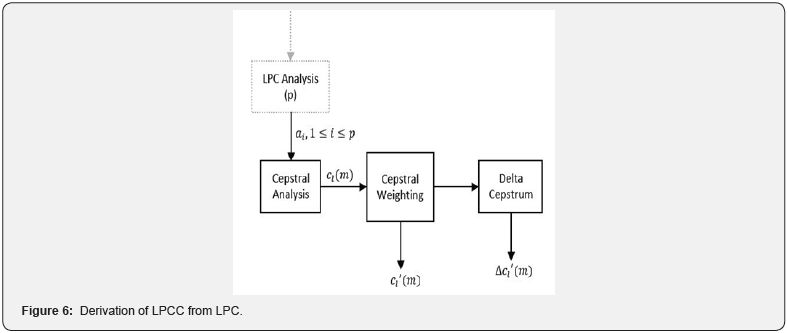
Steps of the LPC model is shown in Figure 5. LPC method brings a linear approach to speech signal for all frequencies. But this is incompatible with human auditory perception. If the speech includes noise, LPC is inadequate for modeling the spectral characteristics of the speech [6]. Cepstral analysis is required to overcome the disadvantage of LPC. A method has been developed to convert LPC parameters to cepstral parameters (LPCC) (Figure 5,6).

Suppose that co= R (0);

Obtaining LPCC from LPC analysis is given in Figure 6.
Mel Frequency Cepstral Coefficients (MFCC)
The MFCC is the most common feature extraction method in speech and speaker recognition. It makes possible to obtain distinctive values for speakers by modeling the frequencies of the human auditory perception [7]. (Figure 7) shows the steps of the MFCC method [8]. In the first step, pre-emphasis, a filter boosts the high frequency of the speech signal is applied.

Framing is to obtain stationary speech parts by dividing the non-stationary speech signal into short periods (~30 ms). Frames are placed by shifting ~10 ms and coinciding ~20 ms part of them. If the length of the frame is longer, it is less stationary. Besides shorter frames make it difficult to capture enough samples [9].

Framing introduces discontinuity into the signal resulting in a distortion. In order to minimize the effect of discontinuity usually, a windowing function such as (Hamming, Hanning, Gauss, Blackman, Rectangular etc.) is utilized. Each frame with N samples in the time domain is converted into the frequency domain by Fast Fourier Transform (FFT). Human auditory perception is approximately linear up to 1KHz, but it has logarithmic values over 1KHz (Mel-Frequency Scale). The structure of the human ear working as a filter is modeled by Mel-Filters [9]. Finally, logarithm compressing the dynamic range and inverse DFT allowing to return to time domain are applied [7].
A speaker-specific voiceprint is created after applying MFCC to the speech signal. Basically, the voiceprint has 12 coefficients. They can be increased up to 42 by taking the first and second derivatives (energy, delta MFCC features, double-delta MFCC features, etc.) [10]. Voiceprints created and modeled in the training phase compared with voiceprints created in the test phase and results obtained.
Modeling
Speaker models are used to represent speaker -specific features stored in feature vectors. The prominent speaker modeling techniques are listed below.
Dynamic time warping (DTW) [11]: Despite being a widely used classification technique in text-dependent speaker recognition systems, it has now left its place in statistical methods. It is useful for solving the timing problem in conversations at different speeds.
Vector Quantization (VQ) [12]: The dimension of the feature vector may increase if whole features of the speaker are used in text-independent speaker recognition systems. VQ is a method of reducing the dimension of the feature vector in which each speaker is represented by a codebook. The code book consists of code vectors that are the averages of feature vectors.
Hidden Markov Model (HMM) [13]: It is a statistical method applied successfully in speaker recognition. HMM creates a statistical model of how the speaker produces voice. Given the model parameters generated for the reference speakers, the possibility of hidden states forming an unknown output sequence is found using the Viterbi algorithm.
Support Vector Machines (SVM) [14]: It is a classification method which divides a space, positive and negative samples are known, into two, tries to find best hyper-plane and support vectors that make the distance between these samples the farther enough.
Gaussian Mixture Model (GMM) [6,15,16]: GMM is a model that works according to the principle of finding the Probability Density Function (PDF) representing the acoustic characteristics of a speaker. The PDF is found from the speaker’s feature vectors by using multiple Gaussian Density Functions. In GMM, the probability of feature vector for the nth frame is obtained from the weighted sum of M multidimensional Gaussian Probability Density Function. Gaussian Mixture Model is expressed as a covariance matrix, mixture weights, and mean vector of each component.
In the training phase, the GMM parameters which are the most suitable for distribution of feature vectors are estimated. The Maximum Likelihood Estimation (MLE) is used for this estimation. MLE can be obtained in an iterative way using a special case of the Expectation Maximization (EM) algorithm. One of the parameters affecting the success and the performance of the GMM method used in text-independent speaker recognition systems is a number of mixtures. If the number of mixtures is low, features of the speaker will not be correctly modeled. If the number of mixtures is high, the performance of the process decreases during the training and testing phases. Experimentally, the optimal number of mixtures can be found for different cases.
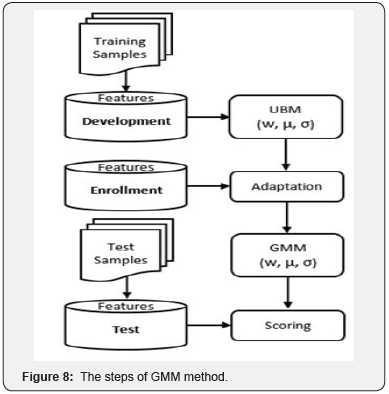
Speaker modeling with GMM method consists of three main stages including development, enrollment, and test. During the development phase, a Universal Background Model (UBM) consisting the feature vectors of all training samples is created. The UBM values found during the development phase are used as the initial values to obtain the GMM in the enrolment phase. GMM values (w,μ,σ) for every person in the training set are found by adapting UBM. The models are compared with test values in the final phase. The steps of the GMM method are shown in (Figure 8).
a. Global means (gm) and global variance (gv) are calculated in order to develop a UBM,
b. (gm) and (gv) are the initial values of the EM algorithm,
c. The sample signal is divided into 2N mixtures to find the Log-Likelihood (LL),
d. LL is used to measure how a model is fitting a data,

e. Frames are distributed to related mixtures,
f. All the steps above are applied to whole training samples (E-Step),
g. The means and variances of mixtures are calculated for each iteration. These values are the initial values of E-Step in proceeding iterations (M-Step),
h. A UBM consisting of weights (w), means (μ), and variances (σ) of each mixture is obtained,
i. Then, GMM values (w, μ, and σ) of each speaker are calculated by adapting UBM values as initial values,
j. Ultimately, the values obtained in the training phase are compared with test values. The posterior probability of UBM and GMM for each frame in test data are calculated. The posterior probability of UBM is subtracted from the posterior probability of GMM and the mean of this subtraction is taken as Log-Likelihood-Ratio (LLR).
I-Vectors [17-20]: I-vectors are an instance of sub-space modeling approach. They are used to decrease the dimension of data before applying classifiers and training. The thought of I-vector emerges from Joint Factor Analysis (JFA) model used in speaker verification. The features of speakers are produced from a multivariate Gaussian Model in JFA. A speech sample is represented by a super vector (M) containing additional components from a speaker and channel (session) subspace. The super vector depending on a speaker is defined as
M = m + Vy +Ux + Dz
In the equation; x, y, and z are low dimensional random variables with a normal distribution (with zero mean and unit diagonal covariance – N (0, I)). These vectors are factors depending on speakers and channels (sessions) in their respective subspaces. m is a speaker and session independent mean distribution super vector that can be produced from UBM. U (eigenchannel matrix) models channel variability (session subspace). V (eigenvoice) and D (diagonal residual) define a speaker subspace.
Firstly, it is necessary to estimate the subspaces (i.e.,) from appropriately labeled development corpora and then estimate the speaker and session factors (i.e.,) for a given new target utterance to apply JFA to speaker recognition. If m,V and D are known for all utterances speaker-dependent features are isolated in low dimensional y and z vectors. The speaker-dependent supervector is given by s = m + Vy + Dz
Test results are obtained by computing the likelihood of the test utterance feature vectors against a session-compensated speaker model. The block scheme of the I-vector based speaker recognition systems is shown in (Figure 9). The aim of using Linear Discriminant Analysis (LDA) is to maximize inter-speaker variances and to minimize intra-speaker variances.

Evaluation
There are various standards for measuring the performance of the biometric systems. One of them is the Equal Error Rate (EER). The False Acceptance Rate (FAR) and the False Rejection Rate (FRR) terms must also be known for EER to be understood.
a. The False Rejection Rate (FRR): It is also called “Type I” error. It indicates the possibility of inadvertent rejection of a person who should be able to access to the biometric system.
b. The False Acceptance Rate (FAR): It is also called “Type II” error. It shows the likelihood that someone who does not have access to a biometric system has access and misidentification as a registered person.
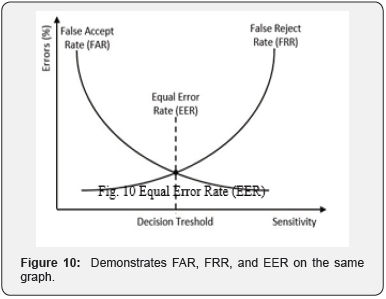
c. Equal Error Rate (EER): In biometric verification systems, the most critical error is expressed as the “Type II” error, but it is desirable that both of the above-mentioned error rates FAR and FRR are low. The low rate of both errors indicates the point where they are equal and it is called Equal Error Rate (EER) or Crossover Error Rate (CER). (Figure 10) demonstrates FAR, FRR, and EER on the same graph. High secure applications require lower false acceptance and higher false rejection rates, while high compatible and user-friendly applications require higher false acceptance and lower false rejection rates.
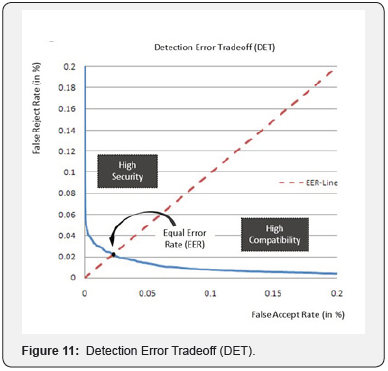
d. Detection Error Trade-offs (DET) Curve: In order to be able to more easily observe the system performance, the EER is represented by Detection Error Trade-offs (DET) Curve as in the figure. The closer the EER is to zero point, the better the system performance as shown in (Figure 11).
Application Details
LPCC and MFCC, the two most prominent feature extraction methods, and GMM and I-vector, the two most powerful textindependent modeling techniques, are applied on our dataset in the scope of this study. The methods are applied to 460 samples obtained from 46 people. There are 10 samples for each speaker. Five of them are used for training and the remaining five samples are used for testing. In the coding step of the methods [10,21,22] are very helpful guides.
In the feature extraction step, a number of the features obtained are 8, 12, 16, and 20 from the LPCC method and 12, 13, 14, 28 and 42 from the MFCC method. The LPCC coefficients are determined by the “order” variable which represents the number of features desired to be obtained. The MFCC coefficients are determined by the parameter “w”:
a. w = ‘’; % Hamming window, without parameter: 12 features,
b. w = ‘0EdD’; % Hamming window parameters,
c. % ‘0’ “0th degree” includes cepstral coefficients: 13 features,
d. % ‘E’ includes log energy: 14 features,
e. % ‘d’ includes delta coefficients (dc/dt): 28 features,
f. % ‘D’ includes delta-delta coefficients (d^2c/dt^2): 42 features.
The models for each speaker are created after getting UBM models in GMM-UBM based applications. Then, the models are compared with test data. The most suitable one is identified by changing the number of mixture components. In the application, some experiments are carried out with 32, 64, 128, 256, 512 and 1024 mixture components. The influence of the number of mixture components on the speaker recognition is observed.
Experimental Results
By using two prominent feature extraction methods LPCC (8, 12, 16, 20 features) and MFCC (12, 13, 14, 28 and 42 features), two different modeling techniques (GMM-UBM and I-vector) are examined. The parameters used in MFCC method are frame length (512 samples), frame shifting ratio (½, 256 samples), number of mel-filters (30), and window type (Hamming). In the GMM Model, the influence of the number of mixtures on speaker recognition is observed. The number of the mixture in GMM is taken as 32, 64, 128, and 256 and the results are evaluated accordingly. The results of feature extraction methods are directly compared without using a different parameter in the I-Vector Model.
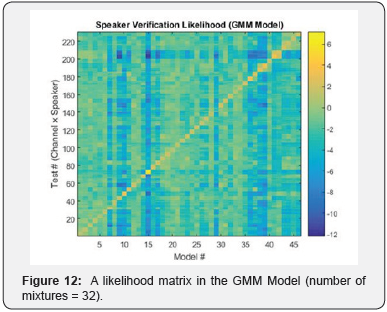
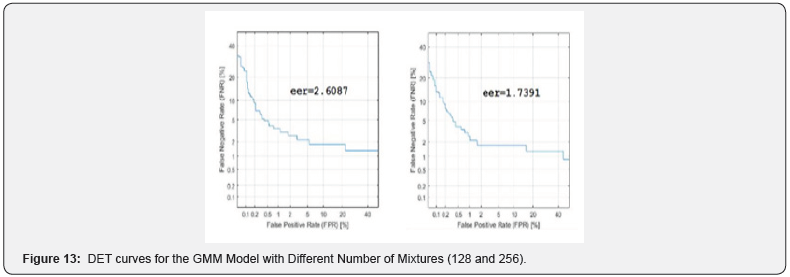
As a result of the application, speaker verification likelihood was found by comparing the models to be used for the test and the models obtained after the training. An example of these likelihood matrices is seen in Figure 12. All the results are also plotted as DET curves. The examples of the DET curves for the GMM Model with a different number of mixtures (128 and 256) are shown in Figure 13. In the following sections, results will be given in tabular form according to the feature extraction-modeling method pair (Figure 12,13).
Experiments and results with LPCC & GMM pair
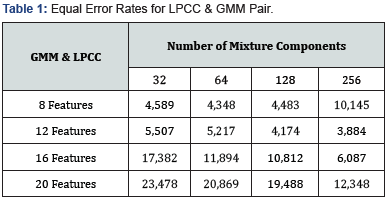
EERs obtained with GMM are tabulated according to a number of LPCC features and mixture components. (Table 1). Increasing the number of mixture components in this method seems to have a positive effect on speaker recognition in general. However, the increase in the number of LPCC features adversely affect the performance. The best result (EER=3,8841) is obtained with LPCC (12 features) and GMM (256 mixtures).
Experiments and results with LPCC & I-Vector pair
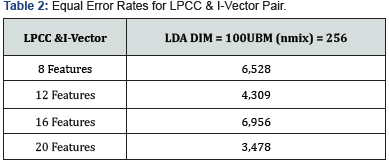
EERs obtained with I-vector are tabulated according to a number of LPCC features (Table 2). The number of mixture components in the UBM calculation is set to 256. LDA dimension in Linear Discriminant Analysis is taken as 100. No significant effect of the increase in the number of LPCC features is detected. The best result (EER = 3,4783) is obtained with LPCC (20 features).
Experiments and results with MFCC & GMM pair
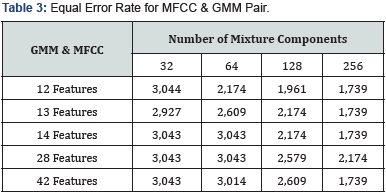
EERs obtained with GMM are tabulated according to a number of MFCC features and mixture components (Table 3). Increasing the number of mixture components in this method seems to have a positive effect on speaker recognition. However, no significant effect of the increase in the number of MFCC features is detected. The best result (EER=3, EER=1,7391) is obtained with MFCC (12, 13, 14 and 42 features) and GMM (256 mixtures).
Experiments and results with MFCC & I-Vector pair

EERs obtained with I-vector are tabulated according to a number of MFCC features. (Table 4) The number of mixture components in the UBM calculation is set to 256. LDA dimension in Linear Discriminant Analysis is taken as 100. No significant effect of the increase in the number of MFCC features is detected. The best result (EER=1,3527) is obtained with MFCC (14 features). At the same time, this result is the best one among the methods used.
Discussion
The Equal Error Rates of the methods examined are given in (Table 5). It is clear that more successful results are obtained from the experiments done with MFCC for feature extraction and I-vector for modeling than the other methods used. The reason why the MFCC method gives more successful results is that obtaining the features better distinguish the speakers by modeling of human ear’s frequency selectivity. The reason for the success of the I -Vector Model is that putting forward the most discriminating features by linear discriminant analysis.
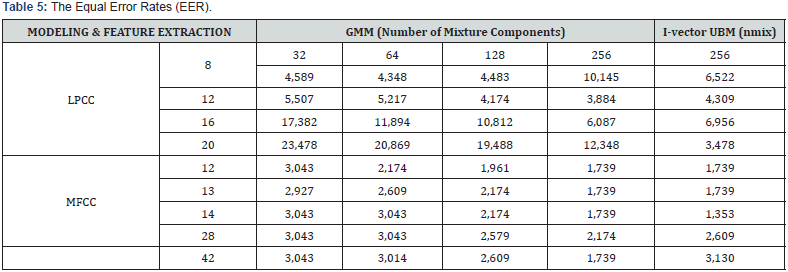
It is seen that MFCC (14 features) and I-Vector (LDA DIM=100 UBM (nmix) = 256) pair give the most successful result (EER=1,3527) in the experiments. When Table 5 is examined in more detail, it is observed that the change in the number of features in LPCC and MFCC does not have a meaningful effect on the results. The fact that the result is not influenced by the change in the number of features occurs also in some different studies on this topic [23] [24]. ΔMFCC in the MFCC method reflects the dynamic features of the speaker. The dynamic features show the variation between successive frames. ΔMFCC is generated by taking the first-order derivative of the cepstrum coefficients. These dynamic features seem to have no positive effect on speaker recognition both in this study and in some other studies examined in this area [15], [16].
Besides that, the increase in the number of mixture components from the GMM parameters has generally positive effects. The results of experiments in which the number of mixture components is increased to higher levels (512, 1024…) are not included in (Table 5) because the performance does not change. The reason why the number of mixture components does not affect the result after a certain level is that the number of mixtures and the highest number of phonemes people can make while speaking Turkish are correlated.
Conclusion
According to the results given in Table 5 the Equal Error Rates with which the highest success rates are achieved and the studies of the researchers who have important publications in this area are compared (the results in bold lines are from our studies). It is seen in (Table 6) (for I-Vector) and (Table 7) (for GMM) that the Equal Error Rates in our experiments are on a competitive level with some other prominent studies in this subject. These results encourage us that better results can be achieved if research and experimentation on methods continue [25,26].


To know more about Juniper Publishers please click on: https://juniperpublishers.com/aboutus.php
For more articles in Open
Access Journal of Reviews & Research please click on:
https://juniperpublishers.com/arr/index.php


Comments
Post a Comment